Introduction
This is the third metric in my Vercel dashboard deep-dive series. We've already covered:
- Fast Origin Transfer (internal CDN ↔ compute bandwidth)
- Fast Data Transfer (CDN → user bandwidth)
Now we’re looking at Edge Requests — the raw count of every HTTP request hitting your Vercel deployment.
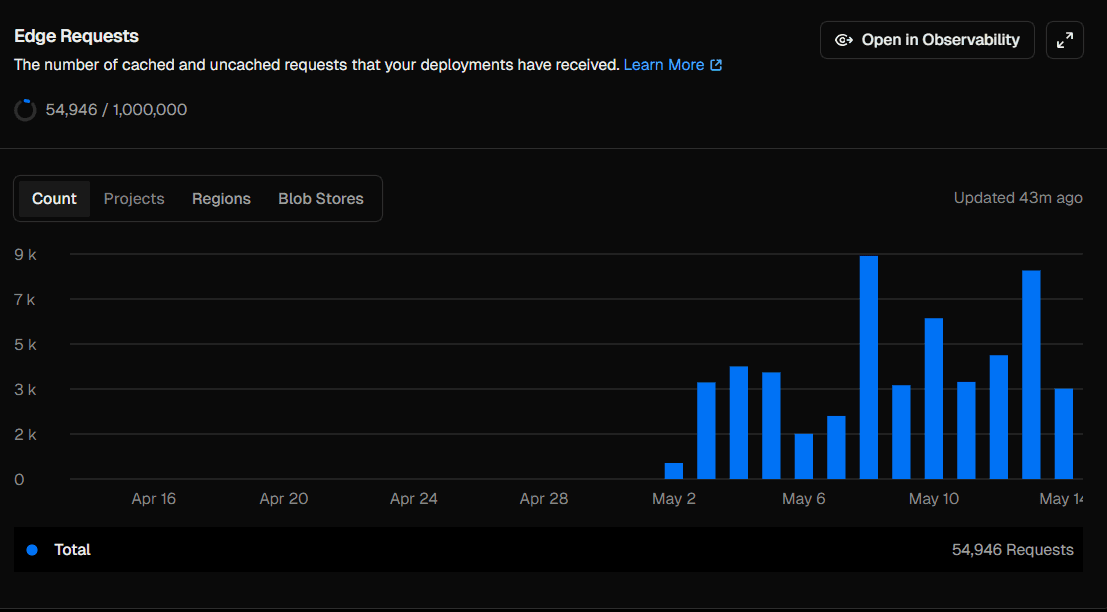
My dashboard shows 54,946 requests out of a 1,000,000 monthly limit. Let’s break down what that actually means.
What Are Edge Requests?
An Edge Request is counted every time Vercel’s CDN receives an HTTP request for any resource on your deployment.
This includes:
- Page loads (HTML documents)
- JavaScript chunks (
_next/static/chunks/*.js) - CSS files
- Images served via Next.js
- Fonts
- API routes (
/api/*) - Favicon and manifest files
Important detail
Even cached requests still count.
So if a file is served instantly from the CDN cache, it still increments your Edge Request counter. This metric measures traffic volume, not compute usage.
Why Are Edge Requests Much Higher Than Page Views?
This surprises most developers.
A single page visit can generate 20–50 Edge Requests.
Here’s a typical Next.js page load:
- 1 request → HTML page
- 3–8 requests → JS chunks
- 1–2 requests → CSS files
- 2–4 requests → fonts
- 1 request → favicon
- 1–3 requests → images
- 1–5 requests → API calls
Example breakdown
If your total is 54,946 Edge Requests, and each visit generates ~20 requests:
≈ 2,700 actual page visits
That matches typical early-stage traffic patterns for a small project.
Reading the Chart
Your chart (mid-April → May 14) tells a clear growth story:
-
April 16 – May 1: 0 requests
- Site deployed but not discovered yet
-
May 2: ~500 requests
- First discovery event (share, post, or referral)
-
May 3–5: 3,000–4,000/day
- Steady early adoption (~150–200 visitors/day)
-
May 6: drop to ~2,000
- Weekend dip (common for developer audiences)
-
May 9: peak ~9,000 requests
- Viral spike (likely Reddit, Twitter, or newsletter)
-
May 10: ~6,500 requests
- Continued momentum from the spike
-
May 11–14: 3,000–4,500/day
- Stabilized baseline after virality
Key insight
Your traffic didn’t just grow — it reset to a higher baseline after the spike.
Cached vs Uncached Requests
Edge Requests include both cached and uncached traffic, but Vercel internally tracks the difference in Observability → Edge Network.
High cache hit rate means:
- Faster user experience
- Lower compute usage
- Lower Fast Origin Transfer
- Fewer serverless invocations
Next.js caching behavior
_next/static/*→ always cached (content-hashed)- HTML pages → depends on SSR / ISR config
- API routes → cache depends on headers
What Generates the Most Edge Requests?
1. Static assets
Every page load triggers:
- JS bundles
- CSS files
- fonts
- images
Even when cached, they still count as requests.
2. Client-side API calls
Each fetch() from the browser is an Edge Request.
Example:
- 5 API calls per page × 200 visitors = 1,000 requests
3. Bot traffic
Crawlers and scrapers often account for 20–40% of total requests, including:
- Googlebot
- Bingbot
- Slack/Twitter link previews
- uptime monitors
4. Image optimization pipeline
Next.js image optimization creates requests like:
/_next/image?url=...&w=...
Each size/format combination = separate request.
How to Reduce Edge Requests
1. Combine API calls
Instead of multiple requests:
// ❌ 4 Edge Requests
fetch("/api/user");
fetch("/api/posts");
fetch("/api/messages");

// ✅ 1 Edge Request
fetch("/api/dashboard");
2. Move data fetching to Server Components
export default async function Dashboard() {
  const [user, posts] = await Promise.all([
    getUser(),
    getPosts(),
  ]);

  return <DashboardView user={user} posts={posts} />;
}
No client-side API calls → fewer Edge Requests.
3. Reduce JavaScript bundles
Use dynamic imports:
const AdminPanel = dynamic(
  () => import("@/components/AdminPanel")
);
Smaller bundles = fewer requests per visit.
4. Optimize caching
Ensure static assets are cached long-term:
Cache-Control: public, max-age=31536000, immutableReturning users generate far fewer requests.
Are You Close to the Limit?
At 54,946 requests:
- Monthly projection: ~110,000 requests
- Hobby limit: 1,000,000 requests
You're using roughly:
~11% of your free tier
Even with growth, you’re comfortably within limits.
Putting All Metrics Together
Now you have the full picture of Vercel’s usage system:
- Edge Requests → how many times your site is hit
- Fast Data Transfer → how much data users download
- Fast Origin Transfer → how much compute your app uses
Together, they represent:
Traffic volume + payload size + compute activity
Conclusion
54,946 Edge Requests sounds large until you translate it into reality:
~2,700 real page visits
The chart tells a clear story:
- No traffic → discovery spike → viral peak → steady audience
Edge Requests aren't just a billing metric — they’re a timeline of your application's growth, one request at a time.