Introduction
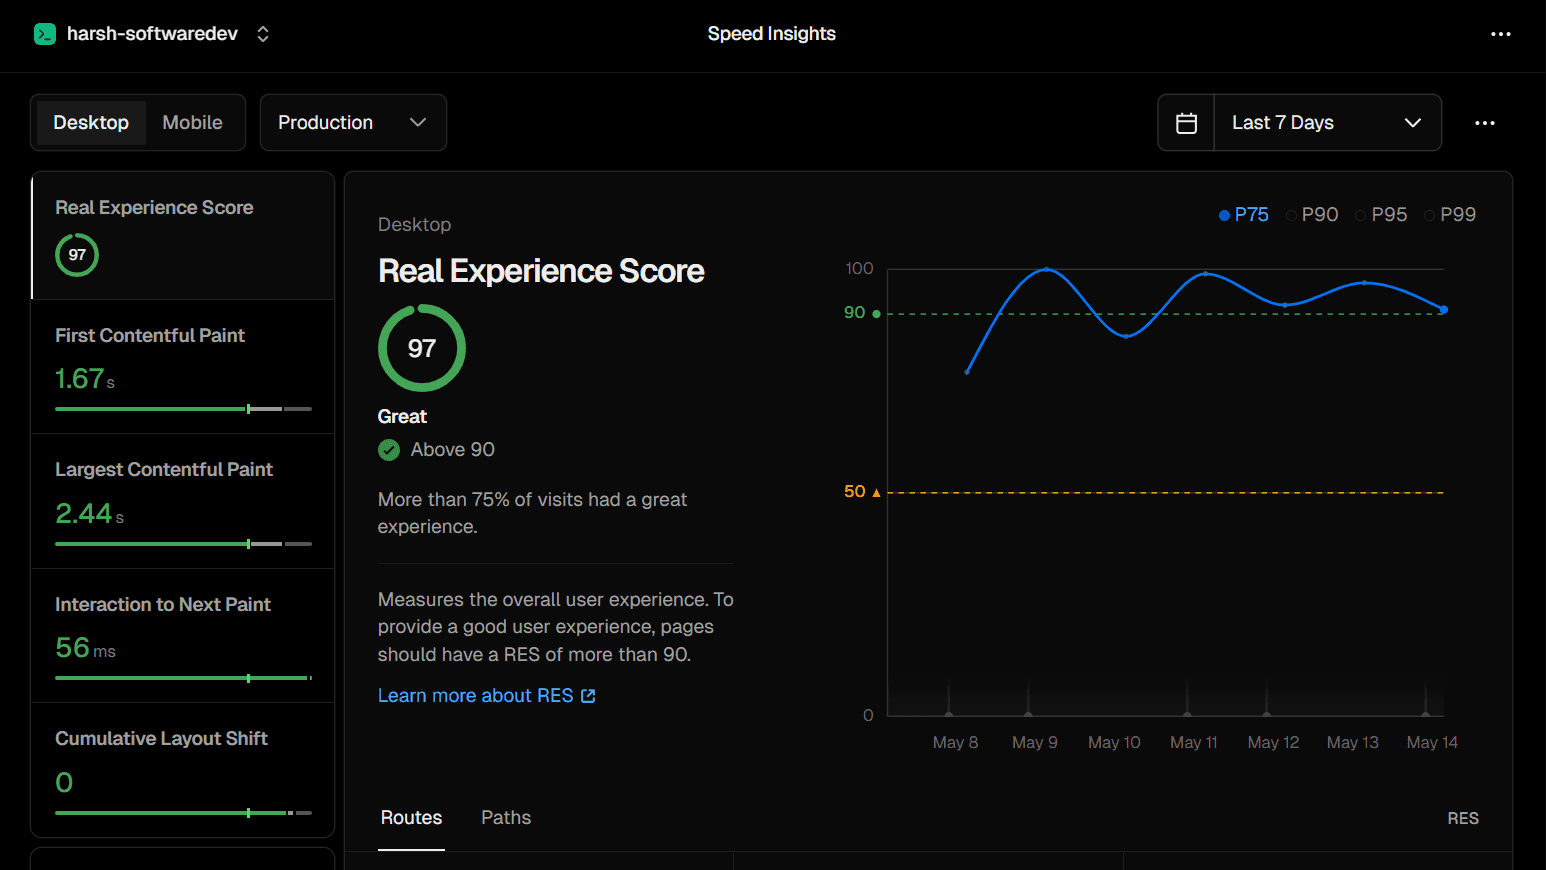
Performance is one of those things developers know they should care about but often deprioritise until launch. I made it a priority from day one — and after a week of real user traffic, Vercel Speed Insights gave me my verdict: a Real Experience Score of 97, rated "Great", with more than 75% of visits delivering a great experience.
In this post I'll break down what every metric on the Speed Insights dashboard means, what my specific numbers say about my site, and the exact techniques I used in Next.js to achieve them.
What is Vercel Speed Insights?
Vercel Speed Insights measures real user performance — not a lab test. Unlike Lighthouse (which simulates a page load on a controlled machine), Speed Insights collects data from actual visitors' browsers as they use your site. This is called Real User Monitoring (RUM).
This distinction matters enormously. A lab test might give you 100/100 on a fast server. But if your real users are on slow Android phones with 4G connections in rural India, their experience is what actually determines your Google ranking.
To enable Speed Insights on your Next.js site:
npm install @vercel/speed-insights// app/layout.tsx
import { SpeedInsights } from "@vercel/speed-insights/next";
export default function RootLayout({ children }) {
return (
{children}
Real Experience Score — 97 / 100
The Real Experience Score (RES) is Vercel's composite metric — a single number that represents the overall quality of your users' experience, calculated from all the Core Web Vitals combined.
- Above 90 — Great
- 50–90 — Needs improvement
- Below 50 — Poor
My score of 97 puts me firmly in the "Great" category. The dashboard also shows this is measured at the P75 percentile — meaning 75% of real visits experienced a score of 97 or better. The remaining 25% might be slower connections, older devices, or visits where something was being fetched fresh.
The chart shows my RES stayed comfortably above the 90 threshold (green dashed line) throughout the entire week of May 8–14, with a brief dip toward 85 on May 10–11 during my traffic spike — which is expected when more diverse users hit the site simultaneously.
First Contentful Paint — 1.67s
First Contentful Paint (FCP) measures the time from navigation start to when the browser renders the first piece of content — any text, image, or SVG. It's the moment the user sees something instead of a blank white screen.
Google's thresholds:
- Good: under 1.8s
- Needs improvement: 1.8s–3.0s
- Poor: over 3.0s
My 1.67s FCP lands in the "Good" range. This means users see my site's first content in under 1.7 seconds — fast enough that the page feels responsive immediately after clicking a link.
What helped achieve this:
- Server-side rendering via Next.js App Router — the HTML arrives pre-rendered, so the browser can paint immediately without waiting for JavaScript
- Minimal render-blocking resources — no heavy CSS frameworks loaded synchronously
- Vercel's global CDN serving from the nearest edge node to each user
Largest Contentful Paint — 2.44s
Largest Contentful Paint (LCP) measures when the largest visible element finishes loading — typically a hero image, a large heading, or a banner. It represents the point where the main content of the page is usable.
Google's thresholds:
- Good: under 2.5s
- Needs improvement: 2.5s–4.0s
- Poor: over 4.0s
My 2.44s LCP is just inside the "Good" threshold — 60ms to spare. This is the metric I watch most carefully because it's the one most likely to slip as I add more content and images to the site.
What helped:
- Using
priorityon the hero image so it loads immediately - Next.js
<Image>component for automatic WebP conversion and size optimisation - Preloading critical fonts with
next/font
import Image from "next/image";
// priority tells Next.js to preload this image
// it becomes the LCP element — load it fast

Interaction to Next Paint — 56ms
Interaction to Next Paint (INP) is the newest Core Web Vital, replacing First Input Delay (FID) in 2024. It measures the time from a user interaction (click, tap, keyboard press) to when the browser updates the display in response. It captures responsiveness throughout the entire page lifetime, not just the first interaction.
Google's thresholds:
- Good: under 200ms
- Needs improvement: 200ms–500ms
- Poor: over 500ms
My 56ms INP is exceptional — nearly 4× better than the "Good" threshold. This means every button click, navigation tap, and form interaction feels instantaneous to my users. The page never feels frozen or sluggish.
What helped:
- Keeping client-side JavaScript minimal — most logic runs on the server
- Not blocking the main thread with heavy computations
- Using React Server Components wherever possible so less JS ships to the browser
Cumulative Layout Shift — 0
Cumulative Layout Shift (CLS) measures visual stability — how much the page content unexpectedly moves around as it loads. If you've ever tried to click a button and had an ad load above it, shifting the button down just as your finger landed — that's a high CLS.
Google's thresholds:
- Good: under 0.1
- Needs improvement: 0.1–0.25
- Poor: over 0.25
My CLS of 0 is a perfect score. Nothing shifts. Every element loads exactly where it will stay.
What ensures CLS stays at 0:
- Always specifying
widthandheighton every<Image>— this reserves the space before the image loads - Using
next/fontwhich prevents font swap layout shifts - No dynamically injected content that pushes existing elements down
- No ads or third-party widgets that load asynchronously and shift content
// Always include width and height — prevents layout shift

// next/font prevents FOUT (Flash of Unstyled Text) layout shifts
import { Inter } from "next/font/google";
const inter = Inter({ subsets: ["latin"] });
Why Core Web Vitals matter for SEO
Since 2021, Google has used Core Web Vitals as a direct ranking signal through the Page Experience algorithm update. Pages that score well on LCP, INP, and CLS get a ranking boost. Pages that score poorly are penalised — even if the content is excellent.
Combined with my Google Search Console data showing a 37.7% CTR and average position of 6.1, a strong performance score means:
- Google is more likely to rank my pages higher
- Users who click through stay longer (low bounce rate) because the page loads fast
- Google interprets low bounce rate as a positive quality signal, further improving rankings
Performance and SEO are not separate concerns — they reinforce each other.
The P75 percentile — why it matters
Vercel Speed Insights (and Google) measure Core Web Vitals at the 75th percentile. This means your score is determined by the experience of the slowest 25% of your users — not the average, not the best case.
This is intentional. Google wants you to optimise for real-world diversity — slow devices, congested networks, older phones. If you only optimise for the best-case user on a fast desktop, your P75 score will expose the gap.
My dashboard also shows P90, P95, and P99 lines. The fact that even my P90 line stays well above 85 tells me the experience is consistently good even for my slowest users.
How to add Speed Insights to your Next.js site
npm install @vercel/speed-insights// app/layout.tsx
import { SpeedInsights } from "@vercel/speed-insights/next";
import { Analytics } from "@vercel/analytics/react";
export default function RootLayout({ children }) {
return (
{children}
Then enable it in your Vercel project dashboard under Speed Insights. Data starts appearing after your first real user visits — not from your own browser sessions.
My 3 most impactful performance tips for Next.js
- Use Server Components by default — every component that doesn't need interactivity should be a Server Component. Less JavaScript shipped = faster INP and FCP.
- Always use next/image with explicit dimensions — automatic WebP, lazy loading, and size reservation all come free. This single change often improves both LCP and CLS simultaneously.
- Use next/font for all typography — fonts are one of the most common causes of layout shift and slow FCP.
next/fontpreloads fonts, subsets them, and eliminates the flash of unstyled text entirely.
Conclusion
A Real Experience Score of 97 isn't luck — it's the result of building with performance as a first principle, not an afterthought. Next.js App Router, Server Components, next/image, and next/font do the heavy lifting, but you have to use them correctly.
The metrics that matter most in my dashboard: LCP at 2.44s (just inside "Good"), CLS at a perfect 0, and INP at 56ms — nearly 4× better than the threshold. Together, they tell Google that my site delivers a genuinely fast, stable, responsive experience for real users on real devices.
If you haven't set up Vercel Speed Insights yet, do it today. The data you get back will show you exactly where your site stands — and what to fix first.