Introduction
Building a portfolio is one thing. Understanding who’s actually visiting it — where they come from, what they read, what device they use — is another.
I’ve been running Vercel Analytics on my site since launch, and after a few weeks of real traffic, the data is starting to tell a clear story.
What is Vercel Analytics?
Vercel Analytics is a privacy-friendly, zero-config analytics tool built into Vercel deployments. No cookies, no consent banners, no cross-site tracking.
It tracks:
- Page views
- Unique visitors
- Referrers
- Countries
- Devices
- Operating systems
Setup (Next.js)
npm install @vercel/analytics// app/layout.tsx
import { Analytics } from "@vercel/analytics/react";

export default function RootLayout({ children }) {
  return (
    <html lang="en">
      <body>
        {children}
        <Analytics />
      </body>
    </html>
  );
}That’s it — no keys, no dashboard setup.
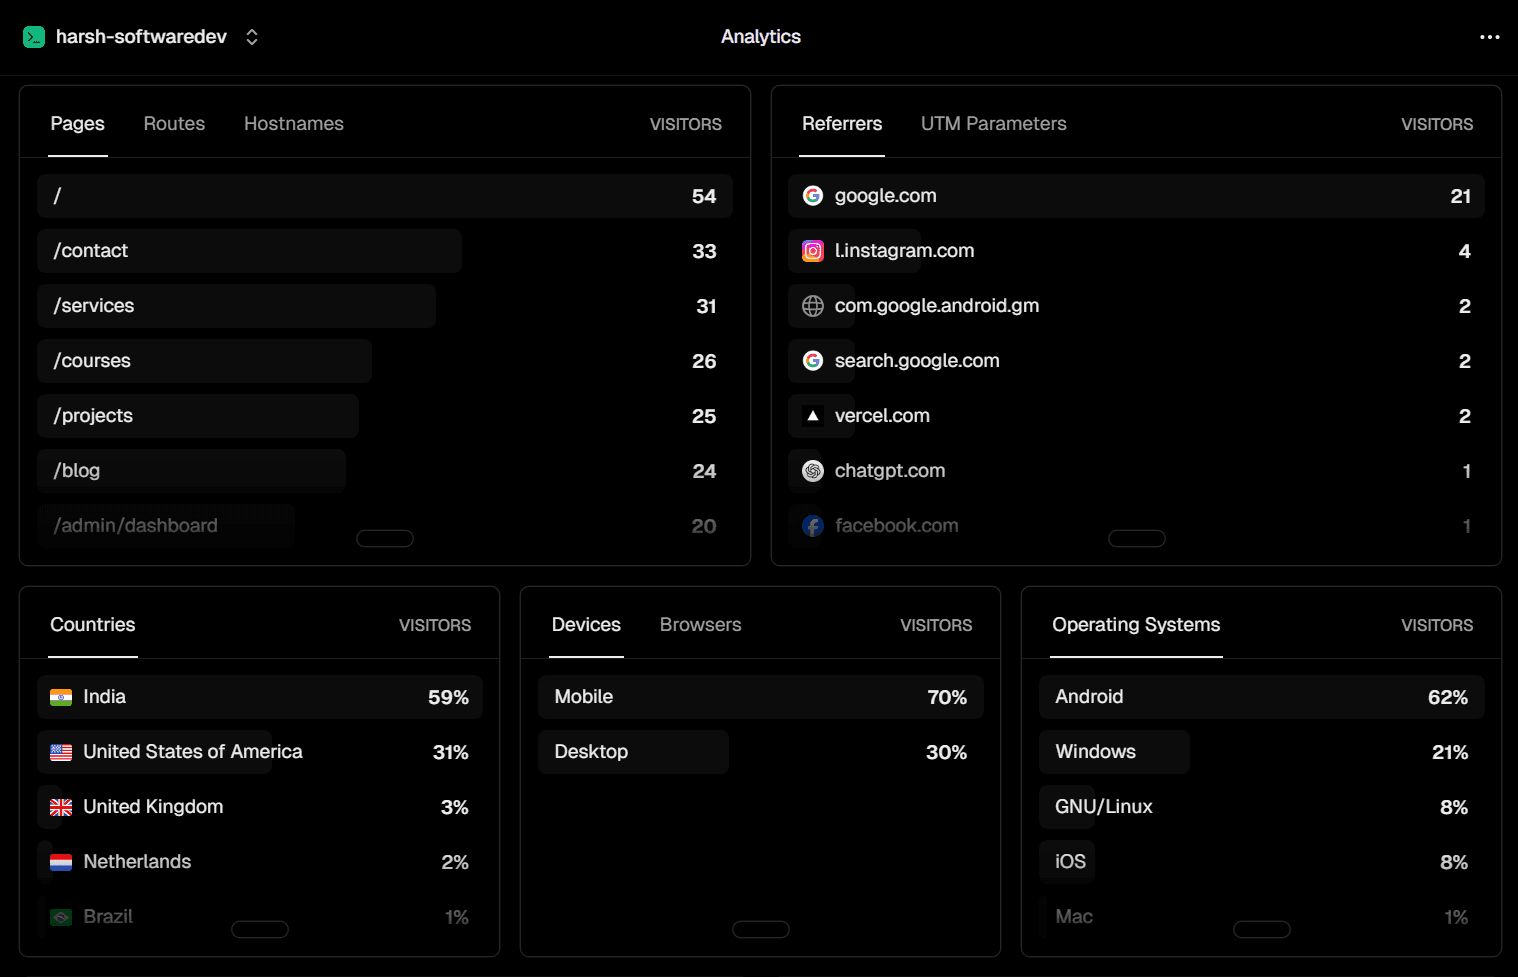
Top Pages — Where Visitors Spend Time
Homepage — 54 visitors
Your entry point. Most users land here first. It’s doing its job: introducing you and funneling people deeper.
/contact — 33 visitors
This is the most important signal in the dataset.
More than 60% of homepage visitors checked the contact page.
That’s strong intent — people aren’t just browsing, they’re considering reaching out.
/services — 31 visitors
Very close to contact page traffic.
This suggests:
- Users are actively evaluating offerings
- Your homepage is successfully converting curiosity into intent
/courses — 26 visitors
This indicates interest in learning, not just hiring.
You have a dual audience:
- Clients
- Learners
/projects — 25 visitors
Classic portfolio behavior — people want proof before trust.
/blog — 24 visitors
Still early, but already consistent traffic.
This will scale with content volume.
/admin/dashboard — 20 visitors
Likely mostly internal traffic.
This should be filtered out for cleaner analytics.
Funnel insight
The navigation pattern is strong:
Homepage → Services / Contact → Projects
That’s exactly what a freelance portfolio should produce.
Referrers — Where Traffic Comes From
Google — 21 visitors
Organic search is already your primary acquisition channel.
Combined with Google Search Console data, this confirms early SEO traction.
Instagram — 4 visitors
Small but meaningful.
This is a high-leverage channel if you post consistently.
Gmail (Android) — 2 visitors
Likely direct shares via email.
Could be recruiters or direct outreach traffic.
Vercel — 2 visitors
Likely from deployment previews or project listings.
ChatGPT — 1 visitor 🤖
This is the interesting one.
It suggests AI-assisted discovery is already starting:
- Someone asked a question
- Your site was surfaced or referenced
This channel will likely grow over time.
Facebook — 1 visitor
Minimal but present — likely a share or dev group post.
Key takeaway
- Google = dominant
- Instagram = emerging
- AI referrals = new and growing channel
Countries — Global Audience Breakdown
India — 59%
Primary audience.
This aligns with:
- Network effects
- Developer communities
- Social reach
United States — 31%
Very important.
This is the highest-value freelance market segment.
UK — 3%
Small but relevant professional audience.
Netherlands — 2%
Strong tech ecosystem — good signal for international reach.
Brazil — 1%
Long-tail global traffic.
Insight
You’re already seeing:
India (volume) + US (value) distribution
That’s an ideal freelance portfolio mix.
Devices — 70% Mobile
This is the most important operational insight:
- Mobile: 70%
- Desktop: 30%
Implication
Most developers design portfolios on desktop — but users browse on mobile.
That means:
- Mobile UX is the real first impression
- Desktop is secondary
Immediate priorities:
- Improve touch targets (44px minimum)
- Fix horizontal scroll in code blocks
- Improve navigation usability
- Ensure 16px+ readable text
- Optimize mobile performance
Operating Systems
Android — 62%
Dominant due to India + mobile-first traffic.
Windows — 21%
Desktop developer audience.
Linux — 8%
Higher-than-average — strong developer signal.
iOS — 8%
Mostly US/UK traffic.
Mac — 1%
Lower than expected but consistent with audience geography.
What this data is actually saying
1. Your audience is mobile-first
70% mobile + 62% Android = clear priority shift.
2. Google is your main growth engine
SEO is already working with minimal content.
3. You have dual audience types
- Clients (Contact / Services)
- Learners (Blog / Courses)
4. You’re starting to get international traction
31% US traffic is significant for a new portfolio.
5. AI discovery is emerging
Even 1 ChatGPT referral is early signal of a new traffic channel.
What to change based on the data
- Mobile-first redesign audit
- Improve
/contactpage conversion flow - Increase blogging frequency (SEO compounding)
- Strengthen Instagram distribution
- Filter internal/admin traffic
- Monitor AI referral growth
Setup Summary
npm install @vercel/analyticsimport { Analytics } from "@vercel/analytics/react";
export default function RootLayout({ children }) {
return (
<html lang="en">
<body>
{children}
<Analytics />
</body>
</html>
);
}Conclusion
Analytics turns a portfolio into feedback-driven product thinking.
The key insights from your data:
- Google is already working
- Mobile dominates traffic
- US audience is strong and valuable
- Visitors follow a clear intent funnel
- AI referrals are beginning to appear
Most importantly:
Your portfolio is no longer static — it’s reacting to real user behavior.
That’s where real iteration starts.