Introduction
There's something exciting about opening Google Search Console for the first time and seeing real data. After building and deploying my portfolio and blog on Vercel, I submitted my sitemap, got indexed, and waited. Seven days later, I had my first real SEO numbers.
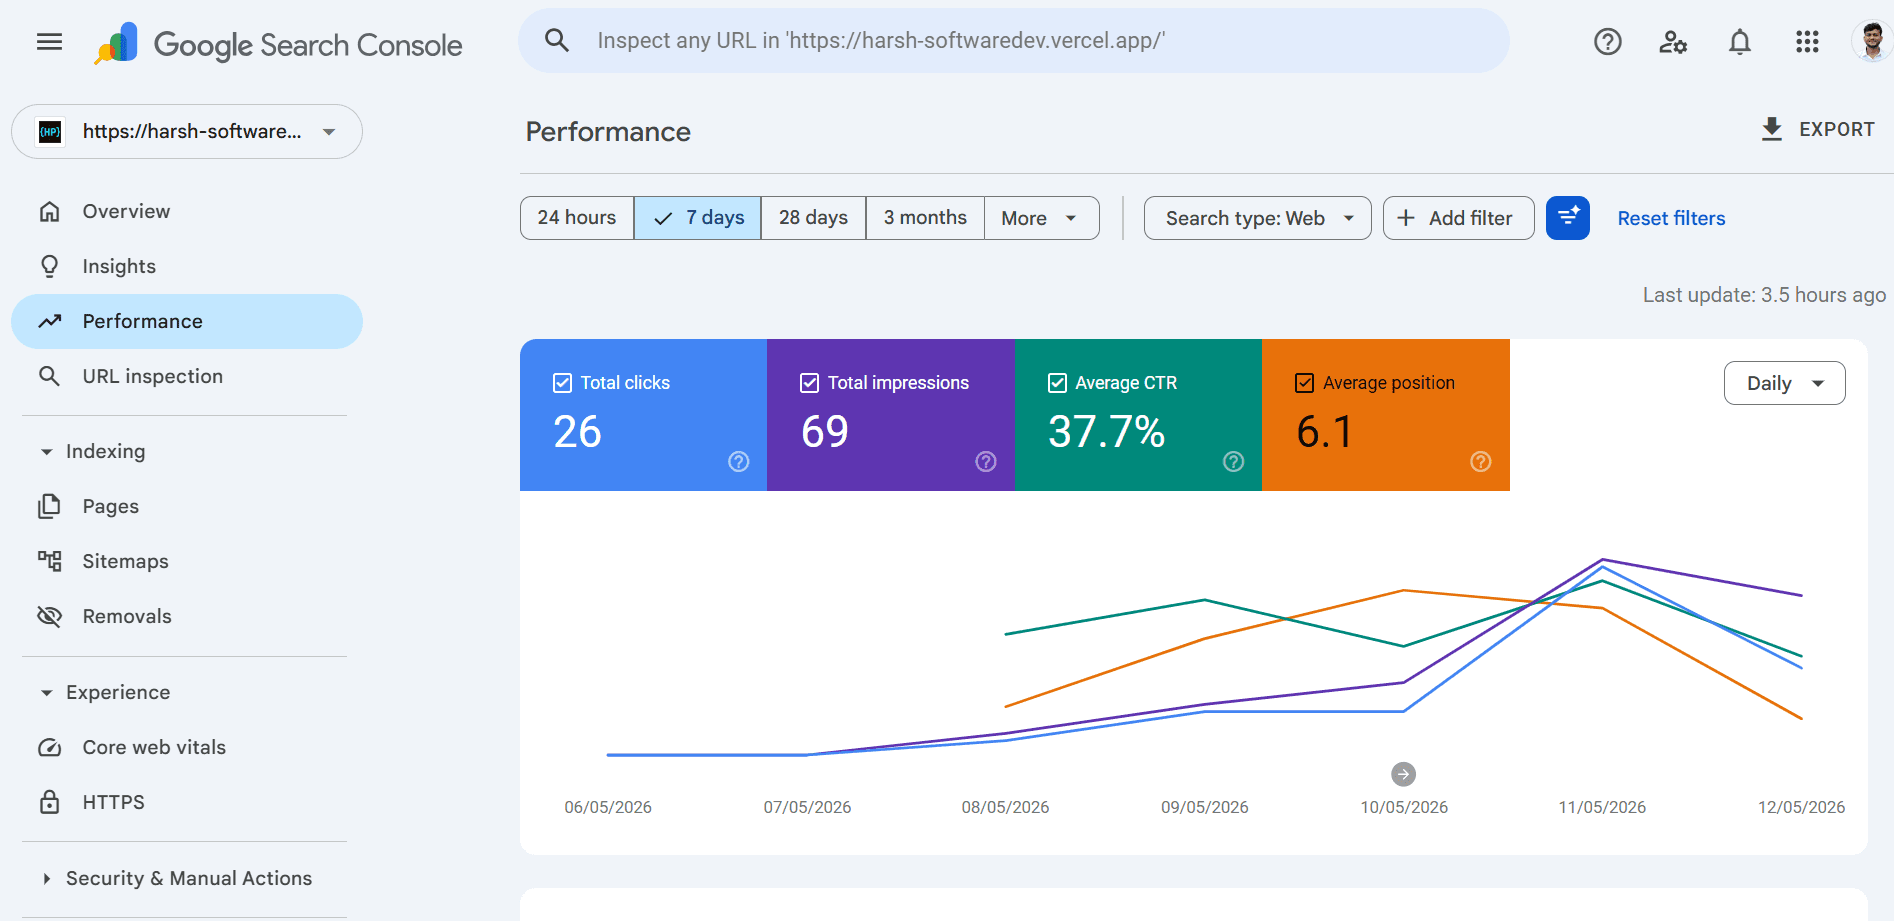
Here’s what the dashboard showed — and what it actually means for a brand new site trying to rank on Google.
The four metrics — a quick primer
Before diving into the numbers, here’s what each metric means:
- Total Clicks — how many users clicked your site from Google Search (real organic traffic)
- Total Impressions — how many times your site appeared in search results
- Average CTR (Click-Through Rate) — clicks ÷ impressions × 100
- Average Position — your average ranking across all queries
My numbers — and what they mean
26 Total Clicks
26 clicks in 7 days is a strong start for a brand new site.
Most new sites get zero clicks in week one because they aren’t indexed or are buried deep in search results.
This means:
- Google has indexed your pages
- Some pages are already visible in search results
- You're ranking for at least some long-tail queries
69 Total Impressions
Your site appeared in search results 69 times in a week.
That’s roughly:
~10 impressions per day
This is early-stage indexing behavior. As more pages get published and crawled, impressions should grow exponentially.
37.7% Average CTR (the standout metric)
This is unusually high.
Typical CTR benchmarks:
- Position 1 → ~28–31%
- Position 2 → ~15–18%
- Position 3 → ~10–12%
- Position 5 → ~6–8%
- Position 10 → ~2–3%
Your average position is 6.1, which usually maps to ~6–8% CTR.
So 37.7% suggests:
- Either some pages are ranking top 1–3 for long-tail queries
- Or your titles/descriptions are highly compelling relative to competitors
Either way, this is a strong signal that your metadata + content alignment is working well.
6.1 Average Position
An average position of 6.1 means you’re hovering just outside the top 5 results.
Implications:
- Most impressions are visible but not always clicked
- Small ranking improvements could significantly increase traffic
- You’re already in “competitive visibility range” for early SEO
For a week-old domain, this is a healthy starting point.
Reading the chart — what happened over time
May 6–7: Flatline
- Almost no impressions or clicks
- Google still crawling/indexing
May 8–9: First visibility
- Impressions begin increasing
- Pages start appearing in SERPs consistently
May 10: Growth spike
- Clicks and impressions rise sharply
- Likely correlated with external traffic spike (social or referral)
May 11: Peak day
- Highest clicks + impressions
- Best average ranking across the dataset
May 12: Normal pullback
- Slight drop in rankings and traffic
- Normal SERP volatility after a spike
What’s driving the high CTR?
A 37.7% CTR doesn’t happen randomly. Common contributing factors:
- Titles that match search intent exactly
- Clear, specific phrasing (not generic “SEO blog titles”)
- Numbers and concrete value propositions
- Strong meta descriptions that act like ad copy
- Lower competition SERPs where position 1 dominates clicks
Next.js metadata example
// app/blog/[slug]/page.tsx
export async function generateMetadata({ params }) {
  const post = await getPost(params.slug);

  return {
    title: post.metaTitle,
    description: post.metaDescription,
    openGraph: {
      title: post.metaTitle,
      description: post.metaDescription,
      images: [post.ogImage],
    },
  };
}
What to improve next
1. Publish more content
More pages = more indexed entry points.
2. Target long-tail keywords
Instead of:
- “Next.js deployment”
Use:
- “how to deploy Next.js app to Vercel with custom domain”
3. Improve pages ranking 4–7
Small SEO improvements can push these into top 3:
- internal links
- better headings
- deeper content
4. Track Core Web Vitals
Google uses:
- LCP
- CLS
- INP
Performance still matters for ranking stability.
Setting up Search Console (Next.js)
1. Add property
https://search.google.com/search-console
2. Verify ownership
// app/layout.tsx
export const metadata = {
  verification: {
    google: "your-verification-code",
  },
};
3. Add sitemap
// app/sitemap.ts
import { MetadataRoute } from "next";

export default function sitemap(): MetadataRoute.Sitemap {
  return [
    { url: "https://your-site.com", lastModified: new Date() },
    { url: "https://your-site.com/blog", lastModified: new Date() },
  ];
}
4. Submit in Search Console
Submit:
/sitemap.xml
Conclusion
26 clicks. 69 impressions. 37.7% CTR. Position 6.1.
For a site that didn’t exist in Google a week ago, this is a strong early signal:
- Indexing is working
- Content is being ranked
- Titles are performing well above baseline CTR expectations
The next phase is simple: scale content and improve rankings from positions 4–7 into top 3 territory.
That’s where real traffic starts.